Over the last several months, I had the opportunity to collaborate with my emLab colleagues, Andrew Plantinga and Hanna Buechi, and our partners at The Nature Conservancy to assemble and analyze a new data set cataloging wildfire damages in California dating back to 1979. The full Issue Brief describing the data set and the trends they illustrate has just been released on March 30, and in this blog I’ll summarize some of the key findings.
The data set this team put together is impressive in novelty of data sources, length of time series, and new outcome variables describing wildfire damages. Most of the heavy lifting was done by Research Analyst Hanna Buechi, who tackled every empirical researcher’s (least) favorite task -- taking a bunch of records from paper documents, spatially digitizing them, and then recoding them for analysis.
These hard copy records came from Cal Fire’s Wildfire Activity Status Reports (also known as Red Books, because yes, they are actually red), which track the number of structures damaged or destroyed by wildfires 300 acres or greater occurring in State Responsibility Areas (SRAs). SRAs are lands for which the State of California has financial responsibility for prevention and suppression of wildfires.
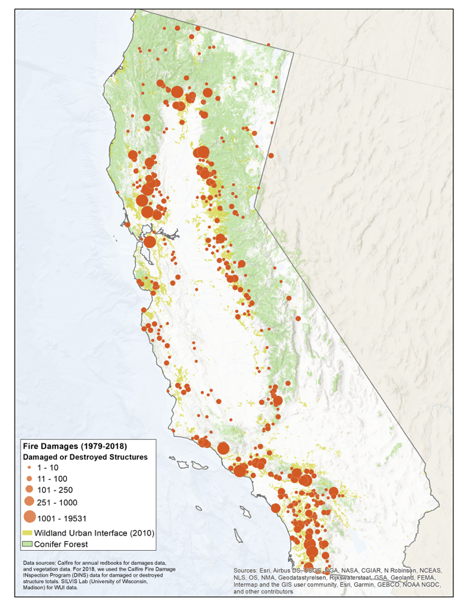
Source: emLab and TNC Issue Brief, Figure 6. Map of structure losses and fire perimeters for SRA fires, 1979-2018
After digitizing all of those records, we then matched damage records for the SRA fires to a broader data set from the California Department of Forestry and Fire Protection (Cal Fire) Fire and Resource Assessment Program (FRAP). FRAP’s data provided geo-referenced fire perimeters for wildfires dating back to the 19th century, but we focused our analyses on perimeters for fires since 1979. Further, for some analyses, we overlaid the fire perimeter data onto geo-spatial data delineating the Wildland Urban Interface (WUI), which refers to areas with a mix of houses and wildland vegetation. Together, these data allowed us to characterize fire counts, area burned, the seasonality of fires, and WUI area burned for all fires in California from 1979 to 2018.
The Cal Fire spatial perimeter data to summarize trends over the last four decades in the annual number of fires, acreage burned overall and within the WUI changes in the duration and intensity of the fire season. Then, for the subset of fires on SRAs, we review civilian and firefighter deaths over time. Finally, we use the counties with highest lost value from structures damaged by these fires. For a glimpse of these trends, the map below taken from Figure 6 in the Issue Brief shows where these damages occured, together with the location of WUI areas.
In this Issue Brief, we let the data speak for itself. While wildfire is a natural process in many parts of California, our data show clearly increasing trends in the area burned overall, the area burned within the Wildland Urban Interface, and damages to people and structures. Read the full Issue Brief here.