a view of the Los Angeles skyline with palm trees in the foreground

Unequal climate impacts to the State of California: Developing a Climate Vulnerability Metric

About

Evidence continues to mount that California’s climate is rapidly changing. Greenhouse gas emissions are increasing temperatures, changing precipitation patterns, and contributing to rising sea levels, creating physical hazards throughout the state. Advances in data and economic research over the last decade have dramatically expanded knowledge of the links between these physical hazards and their impacts on human welfare. A number of these new, empirically grounded studies make it possible to quantify the costs of current and anticipated climate impacts at a local level. This climate economics research can then be used to identify geographic regions and populations that face disproportionate climate risk. 

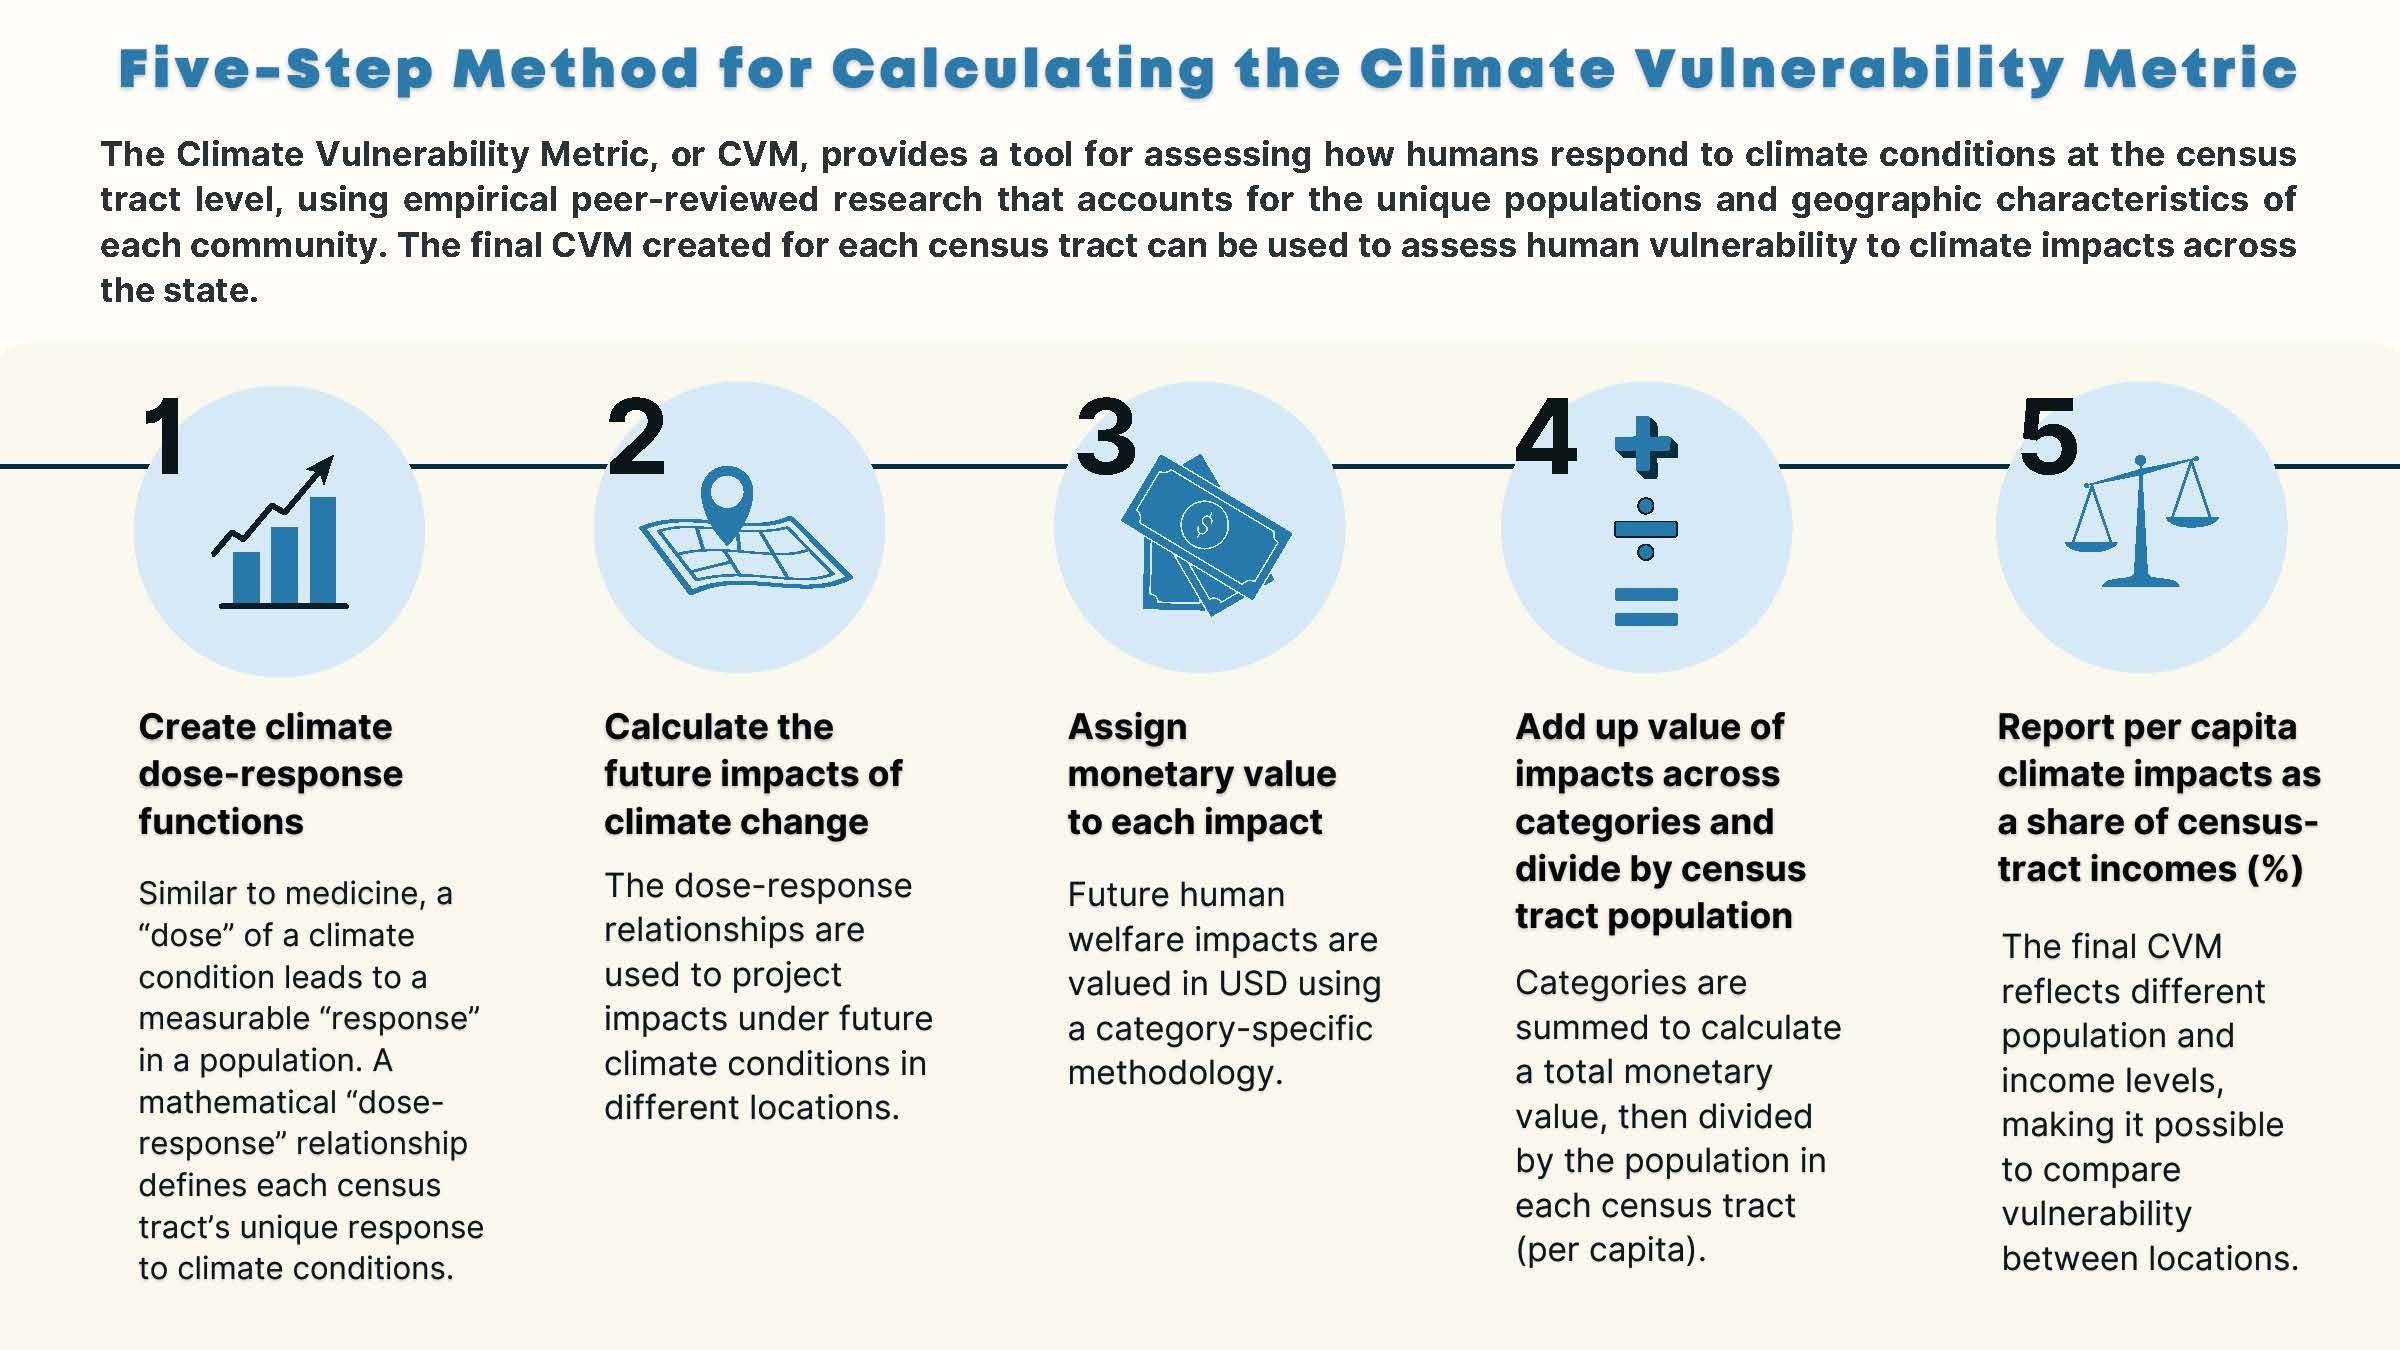
Drawing on this research, this project seeks to quantify impacts of climate change on communities across California. In particular, we aim to identify geographic regions of the State that face disproportionate impacts from climate change by developing a comprehensive measure of vulnerability, the climate vulnerability metric (CVM). The CVM will ultimately help researchers, policymakers, and individuals better assess local-level climate risk and mitigate climate inequities across the State.

Approach

This project draws on recent, data-driven estimates of climate change impacts to construct the CVM. In particular, we leverage new estimates of climate damages that capture differential vulnerability of populations at local scales. While other work on environmental hazards in California has shown how different populations are exposed to different climate and environmental conditions (e.g., extreme heat or air pollution), we aim to additionally account for differential vulnerability to individual categories of climate change impacts, as there is increasing evidence that the same climate conditions can lead to very different impacts for different populations. 

infographic of the five step method for calculating the climate vulnerability metric

To do so, we generate census-tract level estimates of the projected impacts of climate change on human welfare across four impact categories: hours worked, household energy costs, human mortality, and flood-related property damage. We compute projected impacts at midcentury (2050) under a moderate emissions scenario (RCP 4.5) that is broadly consistent with the world’s countries meeting their current emissions reduction pledges under the Paris Climate Agreement. Our estimates are derived from empirical studies that characterize how vulnerable populations, such as the elderly, low-income, and those employed in high-risk sectors, are particularly severely impacted by anthropogenic climate change. We combine these estimates with local demographic and socioeconomic information to generate census-tract level measures of climate change impacts across the State.

There are nine components of climate impacts that when monetized, aggregated, and reported as a share of tract income, produce the total CVM in each census tract. However, other categories such as wildfire or drought can be integrated and added to the CVM in the future as empirical climate impacts research in those areas develops. This format accounts for current levels of economic inequality across California and captures the impact of a warming climate on fundamental aspects of community well-being such as public health, housing, and our ability to earn a livelihood. The higher the CVM for a given census tract, the more damaging the projected impacts of climate change on human welfare. A lower CVM is associated with lower impacts and/or greater resilience, while a negative CVM value represents a projected beneficial impact of moderate climate change by 2050. 

Key findings

map of california displaying the climate vulnerability metric, which is reported as damages as a share of 2019 income

The CVM shows that climate change will have highly unequal impacts across California. While some southeastern regions of the State are estimated to suffer damages that exceed 5% of annual income, other high-elevation northeastern regions of California are estimated to see benefits of up to 10% (importantly, these initial estimates exclude some key impact categories like wildfire). Some low-lying urban areas are estimated to be particularly vulnerable, while much of the Central Valley suffers at least moderate damages. The wide diversity of projected impacts underscores the importance of estimating climate vulnerability at a community level. 

As a tool for California researchers and policymakers, the CVM provides information about the relative climate vulnerability that Californians may face in the future. It offers a better understanding of how certain demographic and socioeconomic characteristics of communities drive differential damages across the impact categories. For example, the CVM could inform climate adaptation and resilience investments, helping to identify where potential impacts could be greatest. The CVM could also be used in combination with existing screening tools to identify communities that are vulnerable both to the impacts of climate change as well as current environmental and health hazards.

Partners

This project is a collaborative effort in partnership with the Climate Impact Lab, Rhodium Group, and the California Air Resources Board.


CVM Workshop

We invited members of the public to participate in a one-hour virtual workshop on Tuesday, January 25th from 4-5 pm PT during which we introduced the scope of this project, shared initial research, took public comments, and held a brief Q&A session. A recording of the workshop is available at the link below.

Video

CVM Workshop Recording

Members of the public were invited to participate in a one-hour virtual workshop on Tuesday, January 25th from 4-5 pm PT during which the team introduced the scope of this project, shared initial research, took public comments, and held a brief Q&A session.